¶ SENTIX FEATURES
Sentix is designed for close-to-instant data analysis in media. Its accuracy and unbiased data are guaranteed by focusing on the most crucial indicators and metrics. Below, you'll find explanations for each part of the Dashboard, which you can use to uncover patterns (e.g., media trends influencing asset price shifts).
¶ Dashboard Explained
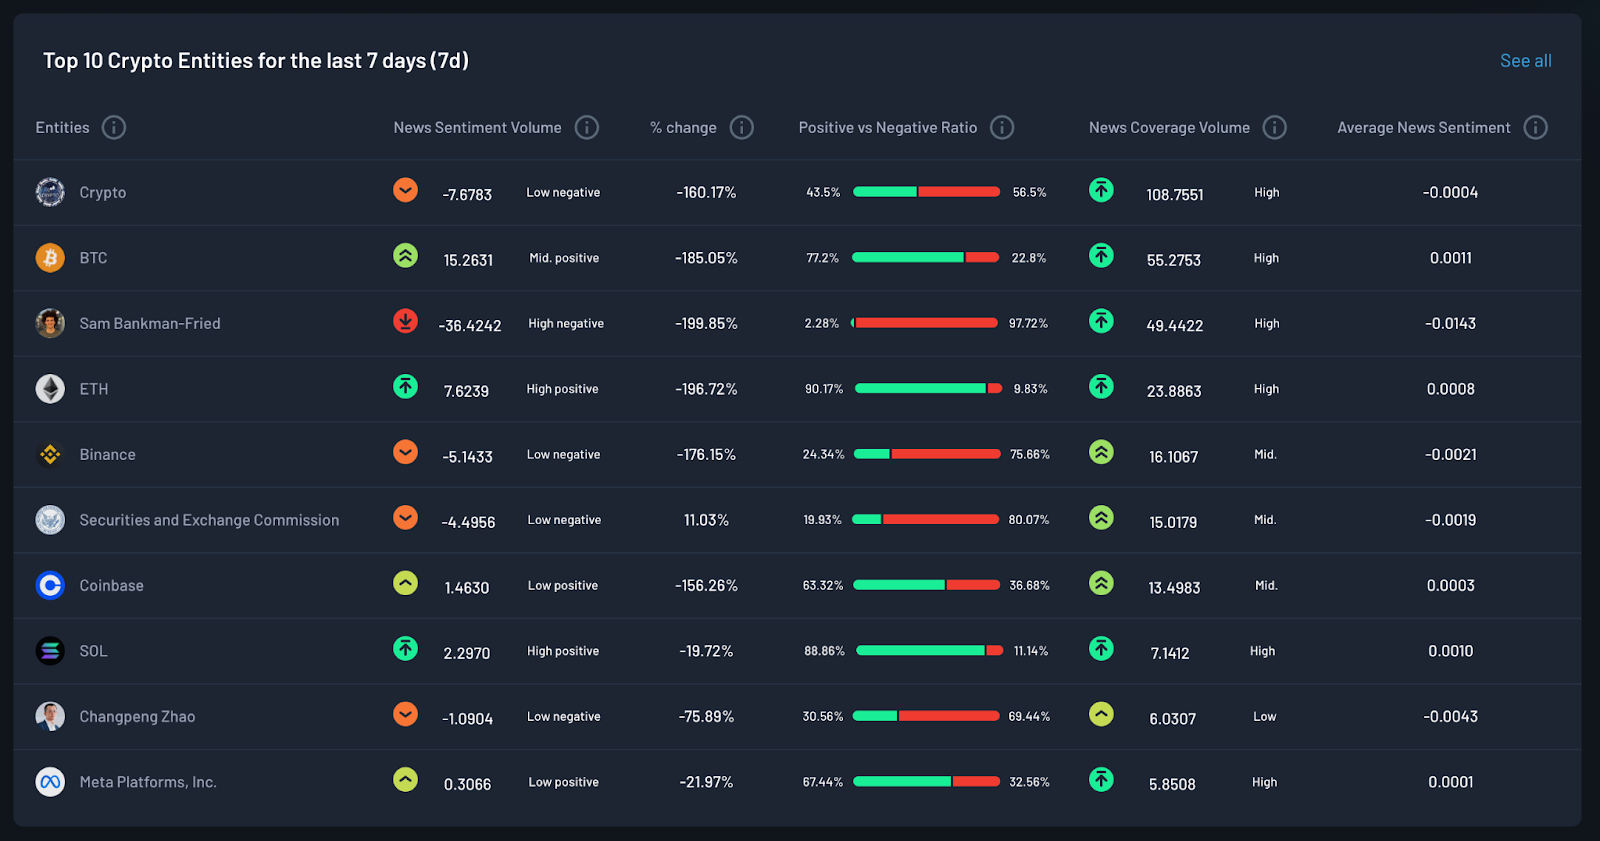
Top 10 Crypto Entities for the last 7days (7d)
The main goal of the Dashboard is to gather all information in one spot, giving you a full view of your asset or the entity you're analyzing within the media universe.
Starting from the right and moving to the left, here’s a breakdown of what each data point on the Dashboard means:
¶ Entities

A broad set of tags that capture everything from key figures and voices in the crypto scene to the coins themselves and the big projects that shape the industry.
E.g.:
- Crypto: Describes the entire cryptocurrency industry.
- BTC: The leading cryptocurrency that influences nearly all events in the crypto space.
- Sam Bankman-Fried: A controversial figure whose dome still concerns millions.
- Binance: The biggest crypto exchange by daily trading volume, etc.
¶ News Sentiment Volume

This data point shows how the global media feels about an important topic over 24 hours, comparing it to the highest levels of news sentiment seen before.
E.g.:
¶ % change

This number tells you about the shift in media sentiment about a topic compared to the previous 24 hours.
E.g.:
If BTC's change is -116.28%, it means the media is -116.28% more negative toward Bitcoin than the day before.
¶ Positive vs Negative Ratio

This shows the balance between good and bad news feelings. If there's more negative news, the overall mood drops. But if positive news outweighs the negative, this ratio will be positive.
E.g.:
¶ News Coverage Volume

This indicator counts how many news stories are out there about crypto or a specific topic. More stories from trusted websites make this number go up. Fewer stories or ones from less trusted sites make it go down.
E.g.:
¶ Average News Sentiment

This figure tells you the overall mood in the news about a specific topic (coin, exchange, project, etc.). It helps see how people feel about that subject or industry.
E.g.:
¶ Top 10 Crypto for the last 7 days (7d)
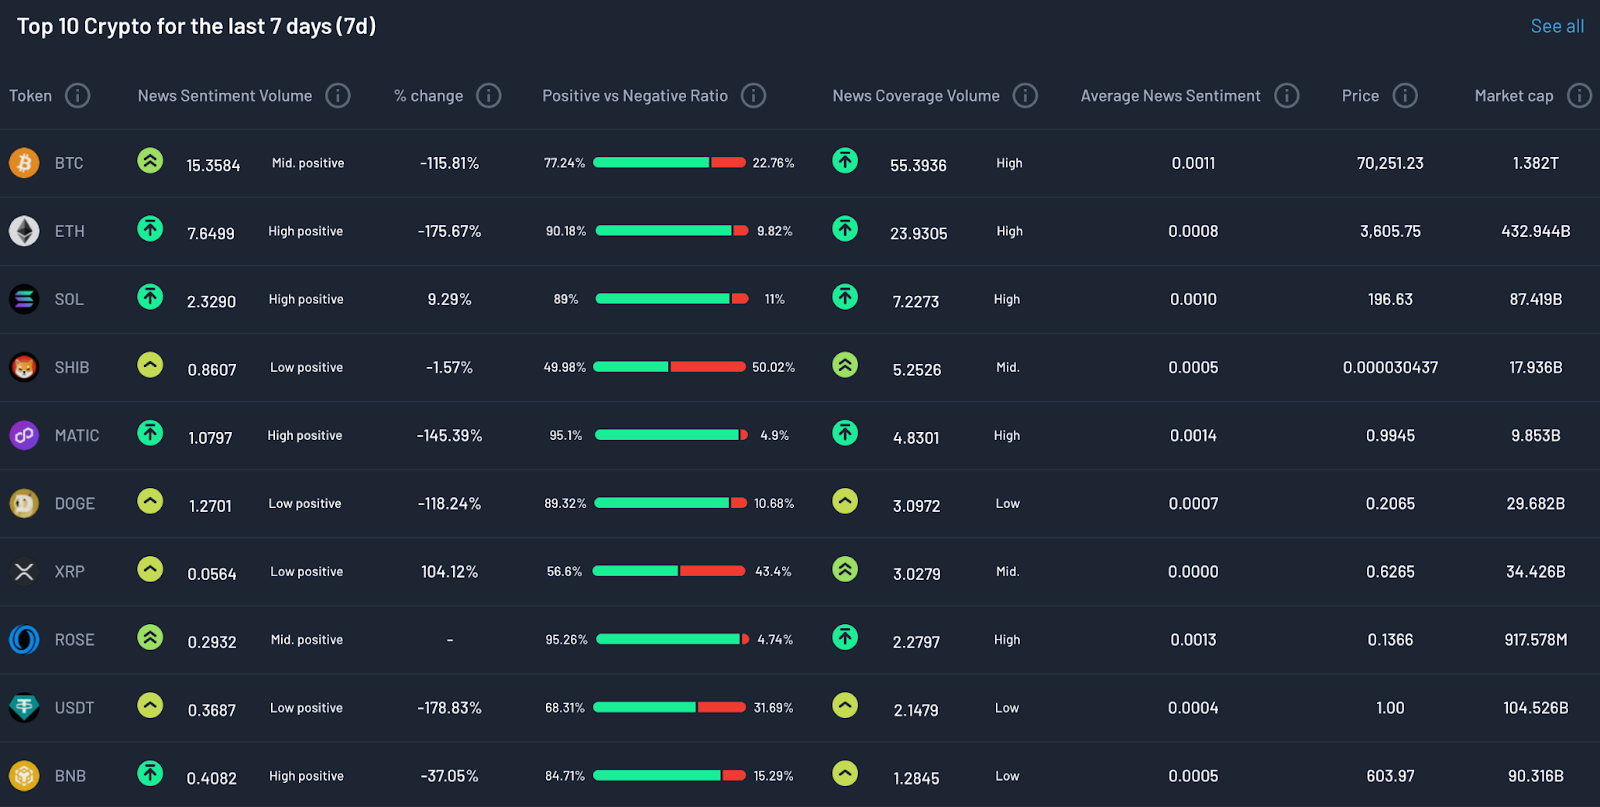
Top 10 Crypto for the last 7 days (7d) – it includes two extra columns: Price and Market Cap for a more accurate analysis.
¶ Price

This is the current value of an asset, as listed on CoinMarketCap.
¶ Market Cap

Tracks the overall market value of a cryptocurrency.
¶ Customizing Dashboard
You can tailor the table data to fit your analysis needs by adjusting a few essential settings.
¶ How to Sort Data Step-By-Step:
- Open the Dashboard: Click the "See All" tab to view the complete dashboard.
- Pick the time frame for the table's data display: 1 Day (1D), 1 Week (1W), 1 Month (1M), or 1 Year (1Y).
- Sort data: Find the dropdown menu (on the upper right side, above the table). Here, you can organize your data by one of three core categories: News Coverage Volume, News Sentiment Volume, and Average Sentiment.
This can help you see the data values in a way that makes the most sense to you.
¶ Visual Data
If you like understanding data through visual tools, Sentix provides various options, such as Graphs and Scales.
¶ SCALES | Definition | Meaning | How Read Data
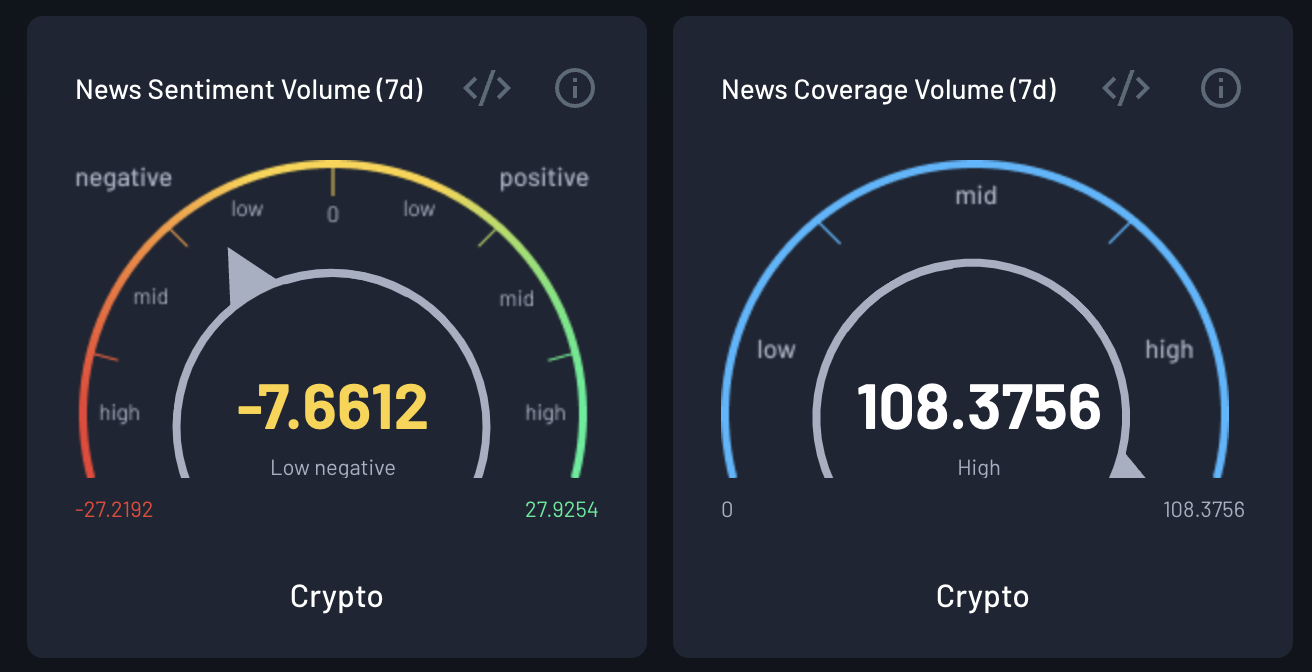
Sentix provides a visual tool called Scales that tracks changes in two key areas:
- News Sentiment Volume: This shows the overall feeling in the media about a specific topic over 24 hours. It fine-tunes the intensity of news sentiment by comparing it to the highest/lowest levels seen in the past.
- News Coverage Volume: Measures the influence of websites covering crypto or a particular subject based on how many articles they publish and their credibility. A higher News Coverage Volume indicates more content from well-regarded sources, while a lower volume suggests less reliable news. The indicator reveals data comparing it to the highest/lowest levels seen in the past.
Analyzing the Scales' data values is one of the simplest ways to quickly grasp the current mood in the media.
¶ Dashboard FAQ
What's the purpose of the Dashboard?
- The Dashboard aggregates all relevant information in one place, providing a complete view of your asset or entity within the media landscape.
How can I use Dashboard data in my crypto trading strategy?
- The Dashboard displays media sentiment, news coverage, and sentiment dynamics over 24 hours, enabling traders to understand real market feelings and adapt their trading approaches.
How often is the Dashboard information updated?
- Information on the Dashboard is automatically updated every 15 minutes.
What's the purpose of the indicators used in the Dashboard table?
- The indicators are designed to display the current media sentiment regarding the coin, including changes over the past 24 hours.
Why does the Dashboard compare the Crypto industry to BTC to build a graph?
- BTC is a key influencer in the crypto market, affecting many altcoins. The Dashboard uses BTC as a reference to show overall market trends.